Make your XF analysis more successful than ever
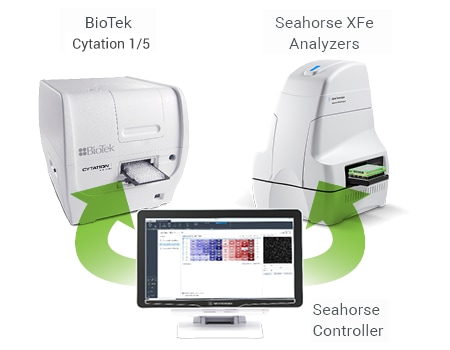
Agilent Technologies offers an integrated imaging and normalization system, combining the robust Seahorse XF metabolic analysis platform with the versatile imaging capabilities of the BioTek Cytation system.
Watch this video to see how this solution improves XF data interpretation.
Improve Data Interpretation
Normalizing your XF data to account for cell number or sample variation makes it easier to compare data across wells, plates, and experiments enabling you to draw meaningful conclusions with confidence.
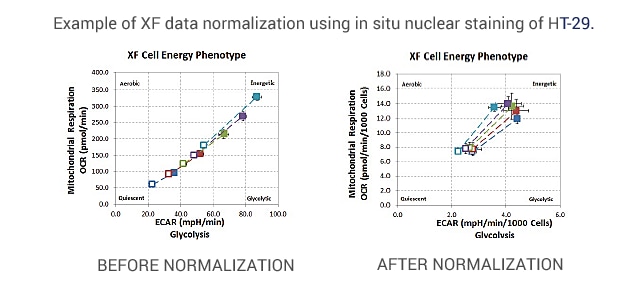
Before normalizing, metabolic phenotypes are scattered throughout the phenogram. After normalizing, metabolic phenotypes cluster around a common basal level and a similar metabolic phenotype.
Cells were seeded at 1×10⁴, 1.5×10⁴, 2×10⁴, 2.5×10⁴, and 3×10⁴ cells per well.
The XF Cell Energy Phenotype Test was performed by injecting oligomycin + FCCP (1.0 μM and 0.5 μM final, respectively) and including 20 μM Hoechst 33342 (2.0 μM final).
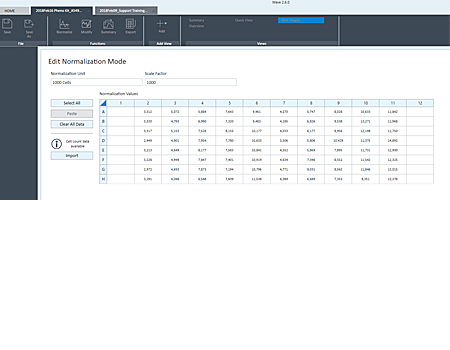
A Turnkey Solution That Integrates Cell Count Normalization Into Wave Software
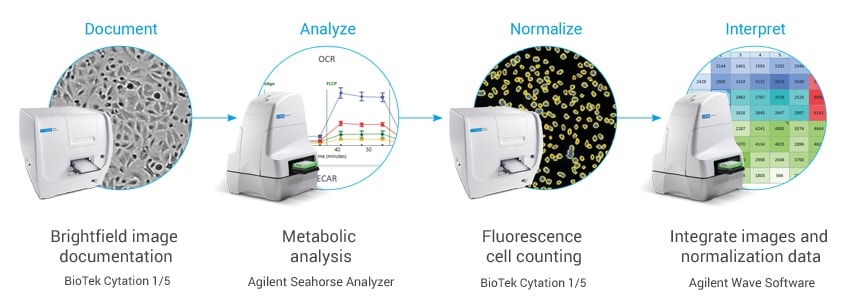
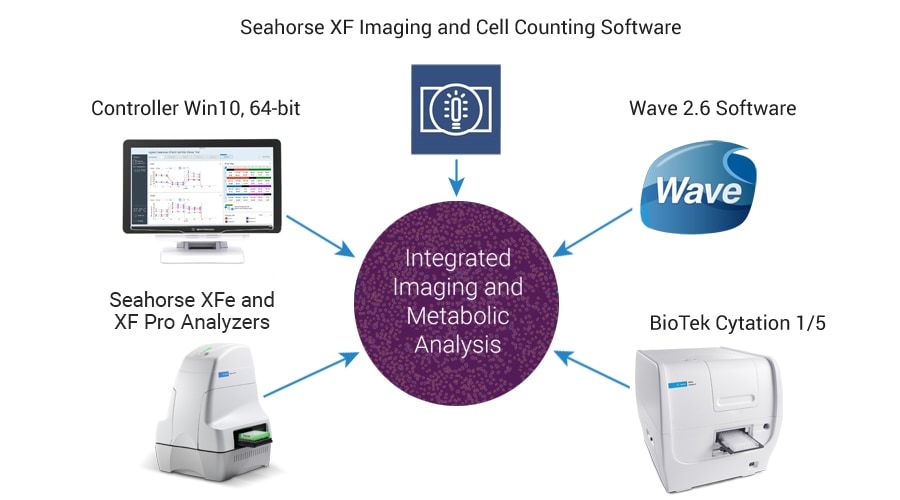
The Agilent Seahorse XF Imaging and Cell Counting software automates and simplifies image acquisition for accurate cell counting.
A unified controller, controlling both BioTek and Seahorse instruments, acquires brightfield (before and after XF assay) and fluorescence (after XF assay) images, to calculate cell counts.
It then seamlessly transfers the images and counts into Wave software.
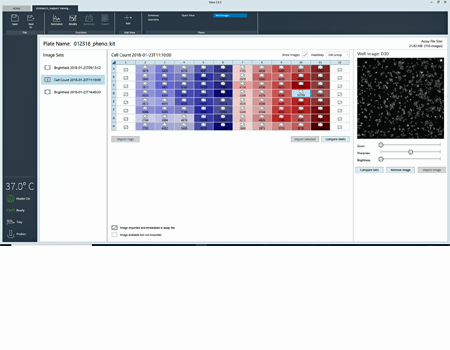
Powerful Software Tools That Improve XF Data Integrity and Documentation
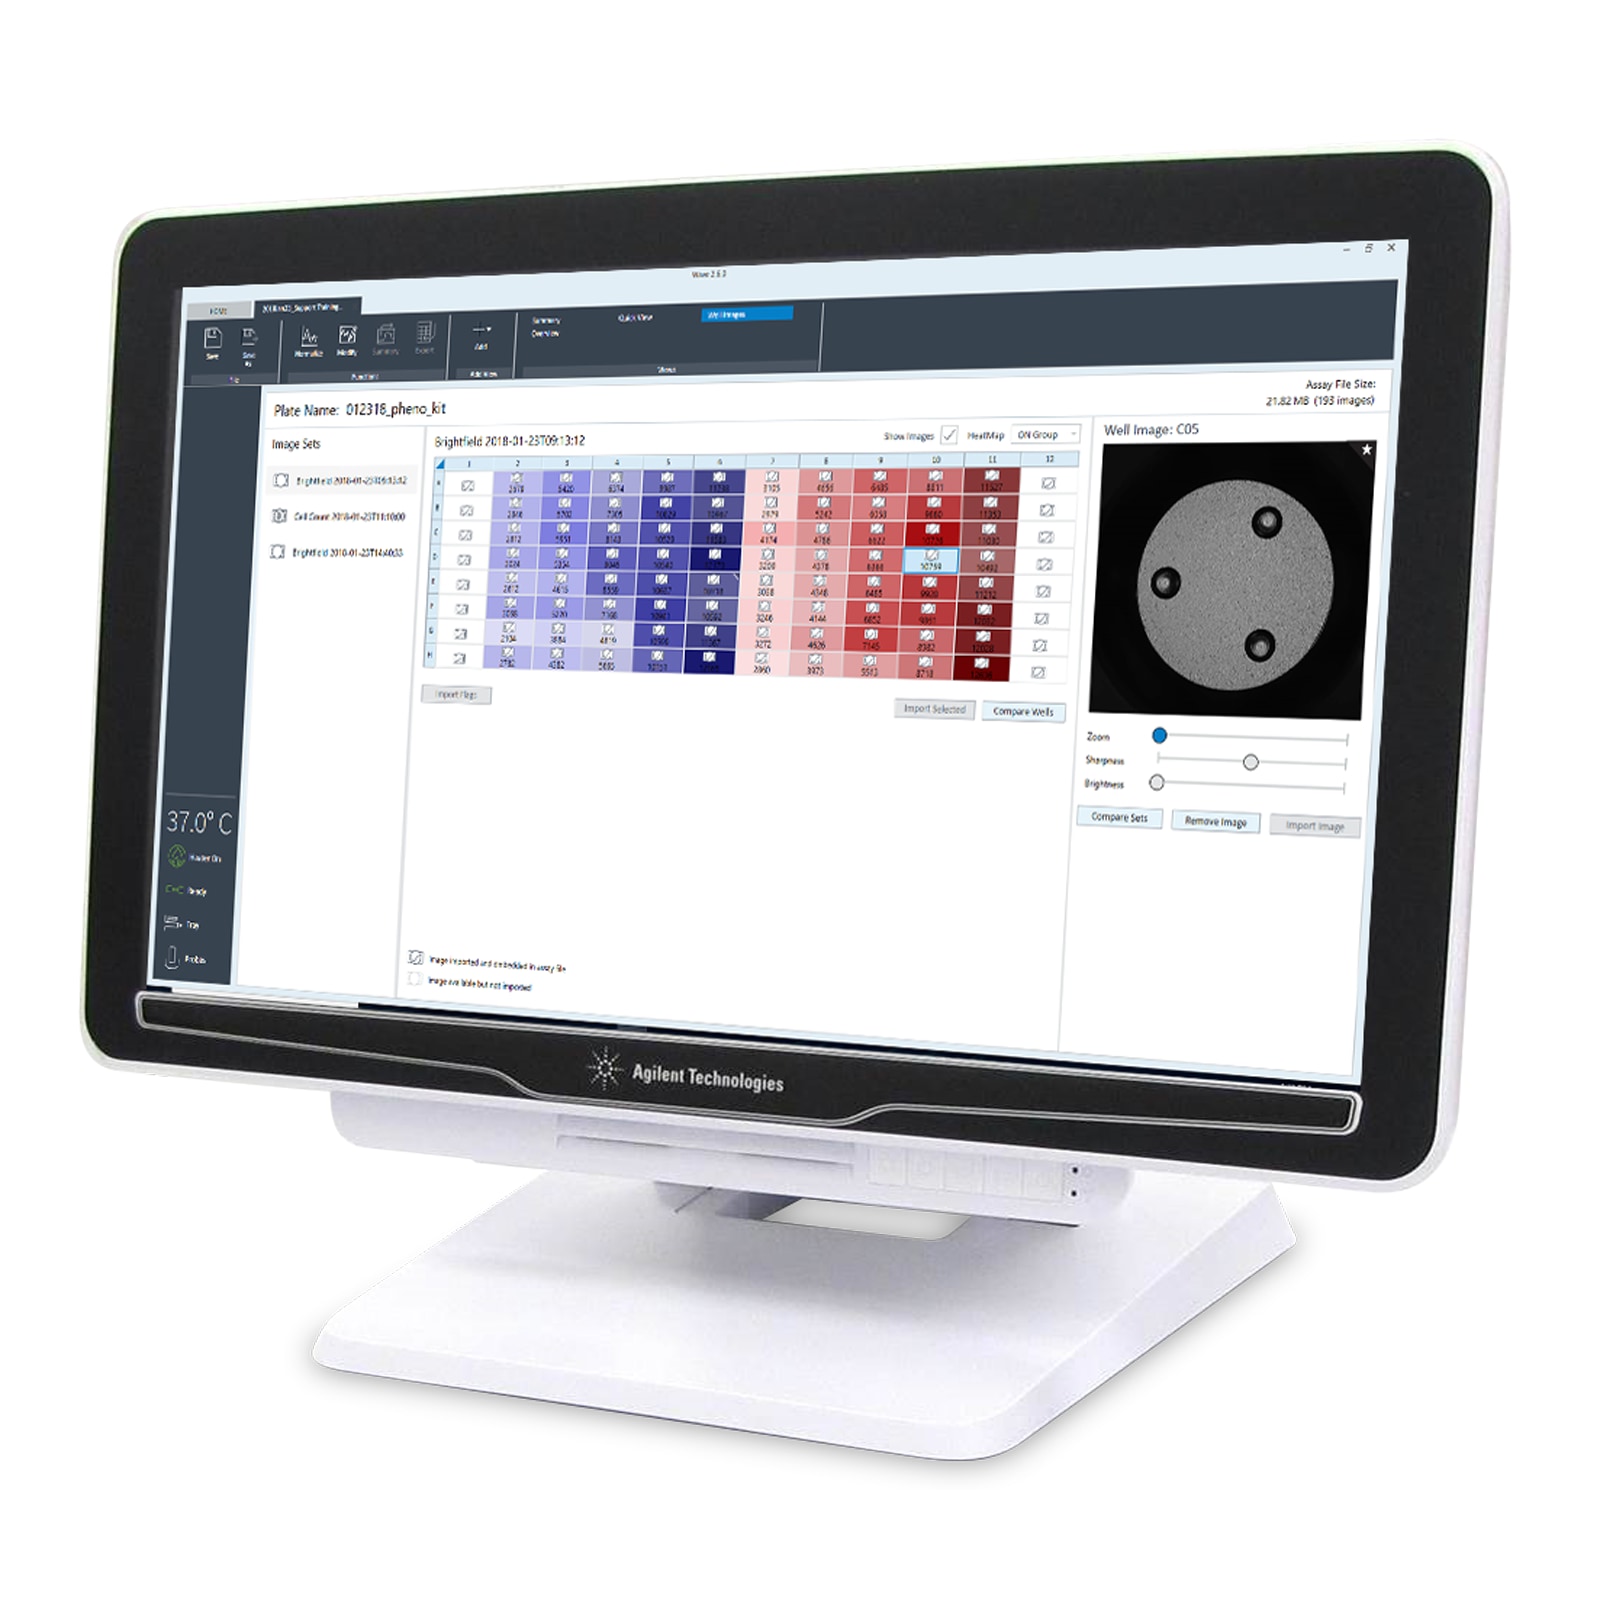
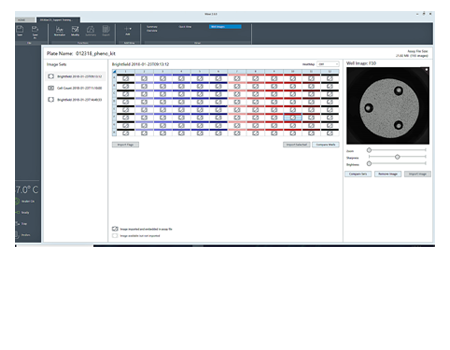
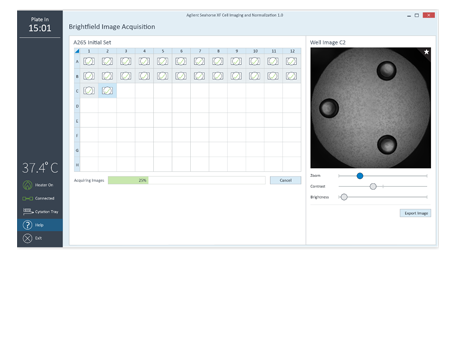
Embedded brightfield images in Wave provide visual feedback and quality control of cell seeding conditions for improving live cell assay reproducibility and XF data quality.
An alert in Wave announces the availability of cell counts and images.
The heatmap display of cell counts enables you to easily evaluate cell seeding consistency.
|
New Wave Tools for Improved Confidence
in XF Data
- New image well view
- Normalization mode alert
- Heatmap display of cell counts
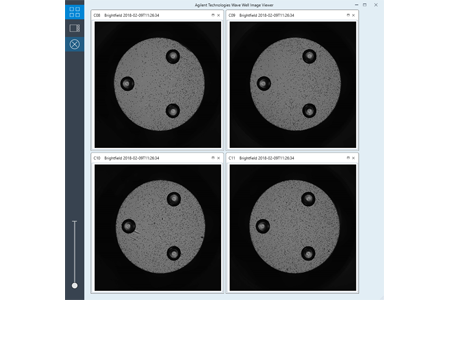
- Compare images
- Flag images
New XF Imaging and Cell Counting Software Optimizes Workflow
- Single, validated acquisition protocols
- Brightfield acquisition, visualization and export
- Image flagging and export
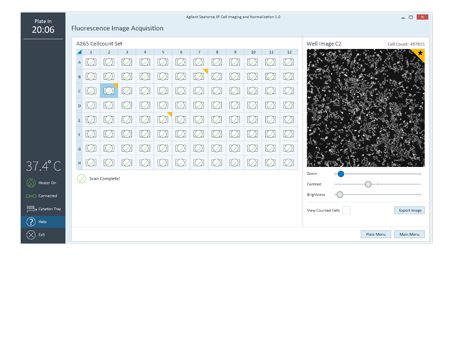
- Fluorescence acquisition, visualization and export
|
|
The gold standard in mitochondrial functionality, providing basal respiration, ATP-linked respiration, maximal respiration and spare respiratory capacity.
Upon entering normalization mode, an alert announces that cell count data are available for that specific plate.
Cell count heatmap displayed with images for easier outlier detection.
Easier comparison of cell seeding conditions provides concrete evidence to support better XF data conclusions.
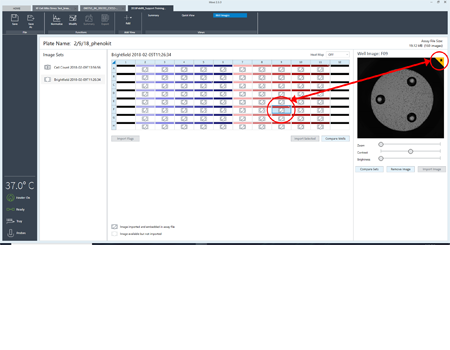
Flag wells as a reminder, either to reference the image or mark it as a contributor to outlier data.
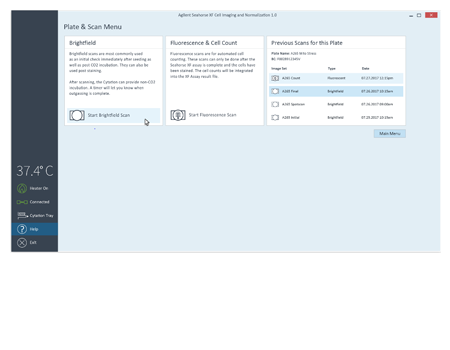
To simplify image acquisition and analysis, single protocols were validated for brightfield and fluorescence imaging. No setup is required. All images associated with the plate can be reviewed.
Make better connections between cell seeding conditions and XF data conclusions.
Assign a flag to an image or well as a reminder to evaluate later in Wave. Export full resolution images.
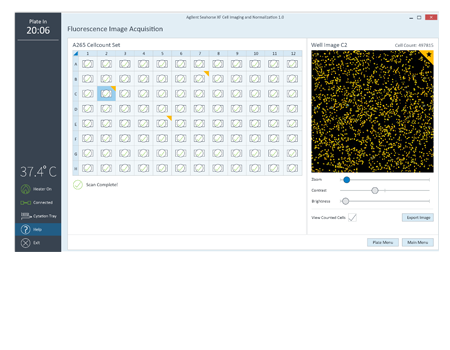
Display of the image analysis mask is used to verify cell counts.
Cell Proliferation Rates Affect XF Data Interpretation
This figure shows an example of XF data normalization performed by
in situ nuclear staining and
in situ cell counting using the imaging and normalization system. The impact that varying cell numbers in each well has on XF data is resolved.
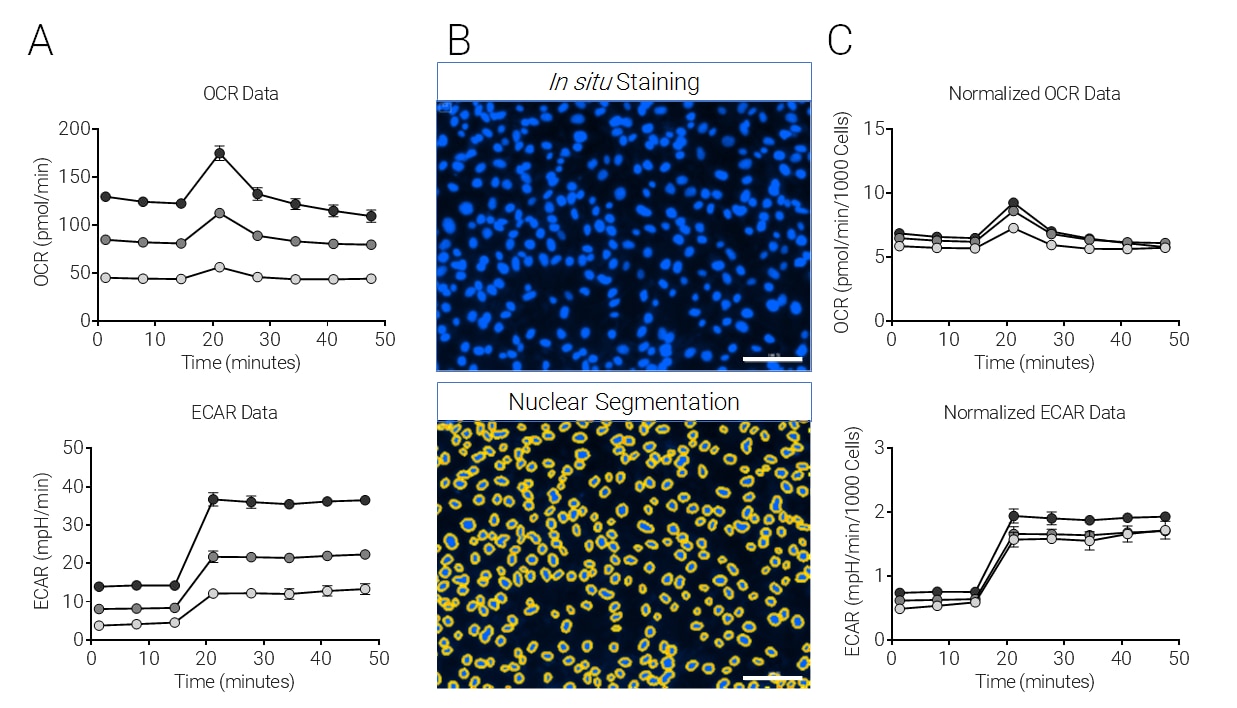
SKOV3 cells were plated at 1×10⁴, 2×10⁴, and 3×10⁴ cells per well, cultured 24 h, and subjected to the XF Cell Energy Phenotype Test followed by image analysis. A) Raw OCR and ECAR change with injection (arrows) of oligomycin + FCCP (1.0 μM and 0.5 μM final, respectively), including 20 μM Hoechst 33342 (2 μM final). B) Representative images of nuclei fluorescently labeled by Hoechst 33342 (upper panel) and nuclei identified and outlined using the Seahorse XF Imaging and Cell Counting Software with the Cytation 1 (lower panel). C) OCR and ECAR normalized by in situ nuclear staining cell counts (Mean ± SD, n=4).
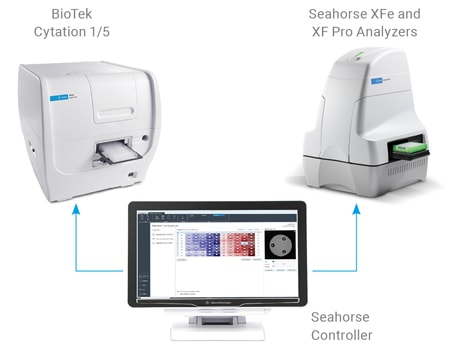
Imaging and Normalization System Components
The completely integrated system requires the following components:
+ Related Support Material
Need more information?
Worldwide Technical Support
USA and Canada
1-800-227-9770; select option 3 then 8
Europe
UK: 0800 096 7632
Germany: 0800 180 66 78
Netherlands: 0800 022 7243
Other EU: +45 3136 9878
Learn more about the XF Imaging and Normalization System Components.
Get in touch with an Agilent Cell Analysis representative representative to schedule a demonstration and see how Agilent Seahorse XF Analyzers can solve your research needs.
For Research Use Only. Not for use in diagnostic procedures.